




Today, teams benchmark a handful of configurations and extrapolate from a space of tens of thousands. We take a different approach: we simulate the serving stack, run through every permutation and combination of the configuration in under ten minutes, and find the optimal deployment configuration before running a single GPU experiment.
This post explains how you get to the optimal GPU deployment configuration fast, and how close the predictions land to real hardware.
Say you’re about to put a 27-billion-parameter model into production. You need it to serve, say, 5,000 tokens a second to your users, and your traffic looks like a coding assistant: ISL ~8,000 tokens, OSL ~300. Then we have to answer: how many H100s do we rent, and how do we run them?
This is not division. Dividing required throughput by single-GPU throughput assumes per-GPU throughput is a constant, and it is not: it depends on how you split the model and on the traffic you serve. The same eight H100s deliver 1,255 or 2,325 tok/s depending only on how the model is split across them, and adding GPUs returns less than linear throughput.
On-demand, an 8×H100 node runs between $55.04 and $98.32 an hour depending on the provider. Every cost in this post is priced at $50/hr - a round figure below the cheapest of those, so the numbers here understate what you would actually pay. Even at that rate one node is $438,000 a year, used or idle.
Buy too many and the waste is obvious - provision 64 GPUs where 24 would have carried the load and you’re paying for 40 idle cards, month after month. Under-provisioning costs more than the GPUs you skipped: you miss your latency target, requests queue, and users see a laggy product. And the fix is slow - adding GPUs means new hardware, re-testing the configuration, and redeploying, so a shortfall you find in production can take weeks to close.
The third failure mode is the least obvious: you can buy the right number of GPUs and still throw away half your performance by arranging them wrong. Eight GPUs can run as one replica split across all eight, as eight independent single-GPU replicas, or several ways in between. In our tests two configurations of the same eight cards delivered 1,255 versus 2,325 tok/s - nearly double, from identical hardware, at essentially the same per-token latency. And no configuration wins for every workload, so the answer you buy today can be wrong in six months.
Figure 1 recasts those numbers as unit cost - the hourly rate of the nodes a configuration occupies, over the output tokens it actually produces in that hour:
At $50/hr per 8-GPU node, 1,255 tok/s gives $50/4.518=$11.07 per million output tokens.
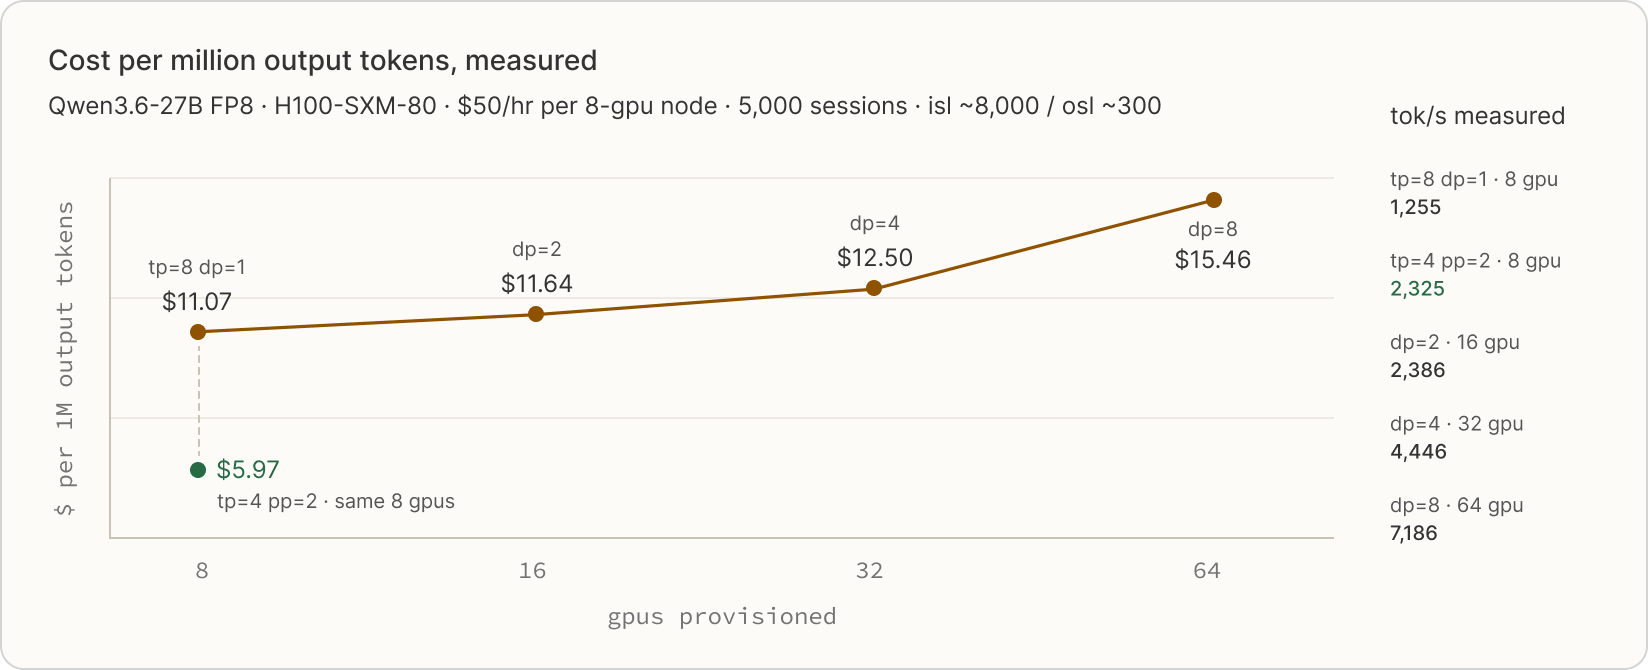
Scaling out raises unit cost: dp=1→8 buys 5.7× the throughput for 8× the gpus, so $/token climbs 40%. Changing only the parallelism on the same 8 gpus cuts it 46%.
Real on-demand rates run $55.04–$98.32/hr; $50 is used throughout as a round figure below the cheapest, so every cost here is conservative.
At the top of the range, multiply by ~2. The percentages do not move.
Each replica takes an eighth of the requests but not an eighth of the work, so the run waits for whichever draws the long prompts.
Figure 1. Unit cost, measured, at $50/hr per 8-GPU node. Two results fall out. Scaling out raises the price of a token: dp=1 to dp=8 buys 5.7× the throughput for 8× the GPUs, so cost per million output tokens climbs 40%, from $11.07 to $15.46. On a fixed 8 GPUs, changing only the parallelism to tp=4/pp=2 cuts unit cost 46% to $5.97, cheaper than every scaled-out option here.
Sizing therefore has two partts : how many GPUs and how they are configured. The sections that follow measure what each configuration does to throughput, TTFT and TPOT.
Every request runs two phases with different bottlenecks. Prefill processes the whole prompt in one forward pass and saturates the GPU’s arithmetic units, so it is compute-bound. Decode emits one token per iteration, and every iteration re-reads the KV cache of every request in the batch. Arithmetic per token is negligible, so decode is bound by memory bandwidth: the rate the GPU streams the KV cache out of HBM.
Every quantity used in this post, defined once:
Which limit you hit first depends on your traffic shape. That limit is the one that will bind you first. Here are examples of a few common workloads.
A coding assistant sends huge prompts and gets short edits back. The prompt carries a whole file plus repo context. At ISL ~8,000 and OSL ~300, prefill is 96% of the token work. Prefill is arithmetic. Thousands of tokens go through every layer at once. A prompt too large for one forward pass is admitted in chunks. One chunk per iteration. Each of those iterations spends most of its budget on prefill. Little is left for decode. Decode throughput falls for the whole batch while that prompt is read. TPOT rises for every request already decoding. The chunked request waits more iterations for its own first token. Binds on compute.
A chatbot sends short prompts and needs a steady stream of words back. The request is almost entirely decode. One iteration advances every active request by exactly one token. That makes TPOT the iteration time. Iteration time is set by how fast the GPU streams the weights and the live KV cache out of memory. Arithmetic is not the limit. Admitting one more request lengthens the iteration. Measured p99 TPOT here is ~48 ms against a 50 ms target. There is room for very few more before the SLO breaks. The SLO caps batch size. Batch size caps tokens per second per GPU. Serving the same traffic then takes more replicas. VRAM is not the wall here. Most of it sits unused. Binds on memory bandwidth.
A reasoning or agent workload writes far more than it reads. Long chains of thought, thousands of output tokens. Every output token appends to the KV cache. A request’s cache grows several times over while it runs. Fewer new requests fit as the live ones age. The batch drains faster than it refills. Aggregate throughput decays over the run. Decode also re-reads the whole live cache every iteration. TPOT rises as requests age. Binds on VRAM.
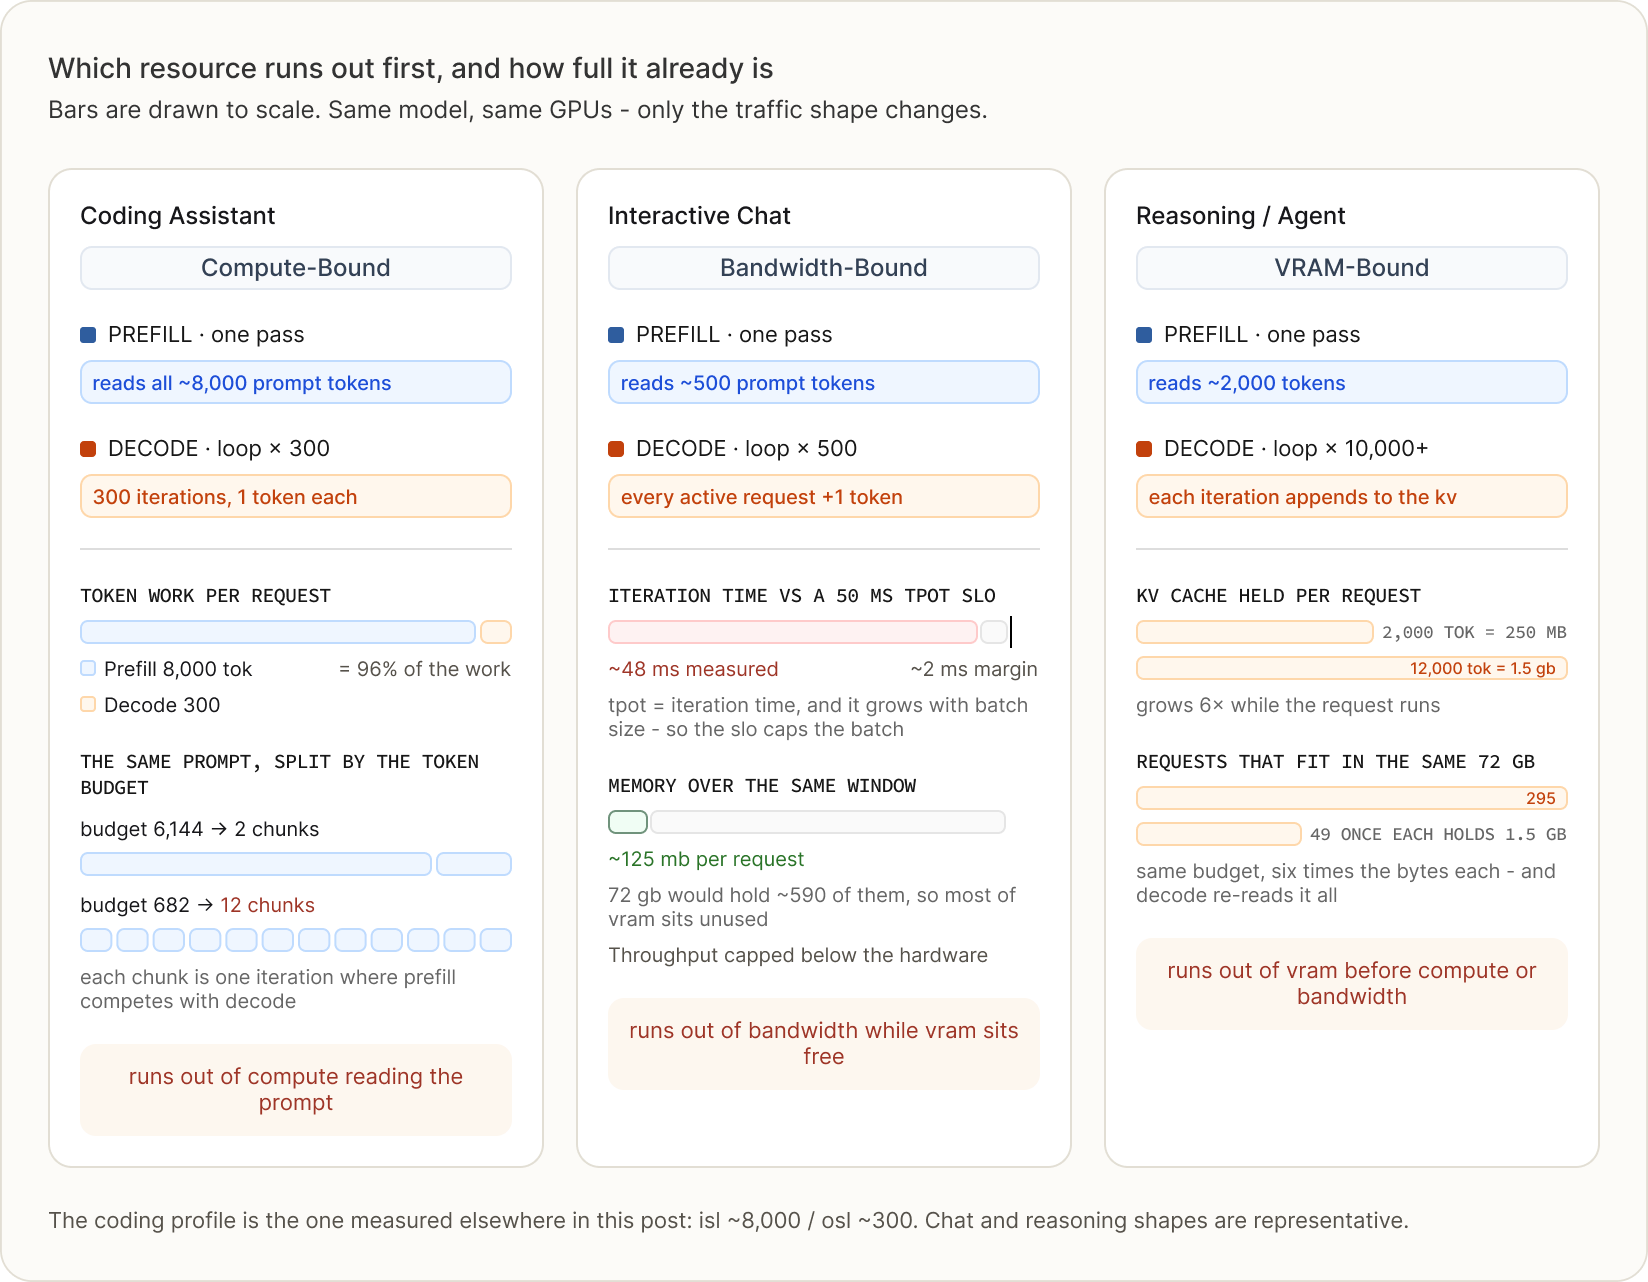
Figure 2. Every request runs prefill once, then decode in a loop. Each panel shows which resource runs out first, drawn to scale. Coding is compute-bound. Prefill is 96% of the work. A prompt too large for one pass is split into chunks that then compete with decode. Chat is bandwidth-bound. Each iteration streams the weights and the live cache. 48 ms of a 50 ms target goes before the batch can grow. Most of VRAM sits unused. Reasoning is VRAM-bound. Cache per request grows 6× as it runs. The number that fit falls 6×, from 295 to 49, while they are still running.
A benchmark published for one of these traffic shapes carries no information about the others.
Each knob trades one outcome against another:
Tensor parallelism. Splitting each layer across more GPUs cuts the work per GPU per token. Each step gets faster, up to a point. Past that point, the GPUs spend more time syncing with each other than computing. Figure 3 shows this point for this model. TP=8 is past it. Switching to TP=4 with PP=2 on the same 8 GPUs raises throughput from 1,255 to 2,325 tok/s, an 85% increase, at almost the same TPOT. Raising TP also uses up GPUs that could have gone to replicas instead, since total GPUs = tensor parallelism × pipeline parallelism × replicas.
Replicas. Each replica is a full copy of the model on its own GPUs. More replicas means more total throughput, but not in direct proportion. Requests are split evenly by count across replicas. They are not split by how much work each one needs. One replica can end up with the longer prompts. The whole run has to wait for that replica to finish.
Batch size.A bigger batch lets you spread the cost of loading the model's weights across more requests, so throughput goes up almost for free at first. That stops once the KV cache for all those requests gets bigger than the weights themselves. Past that point, every extra request adds real work: more bytes to stream, more compute to run. Throughput keeps rising, but so does the time per output token, because each step now takes longer.
Precision. Running the model in FP8 instead of BF16 halves the size of the weights. That frees up memory for a bigger KV cache and cuts the bytes decode has to move each step. The cost is accuracy. Compressing the KV cache this way loses more accuracy than compressing the weights does, because the cache gets re-read on every single step.
They are coupled. They cannot be tuned one at a time.
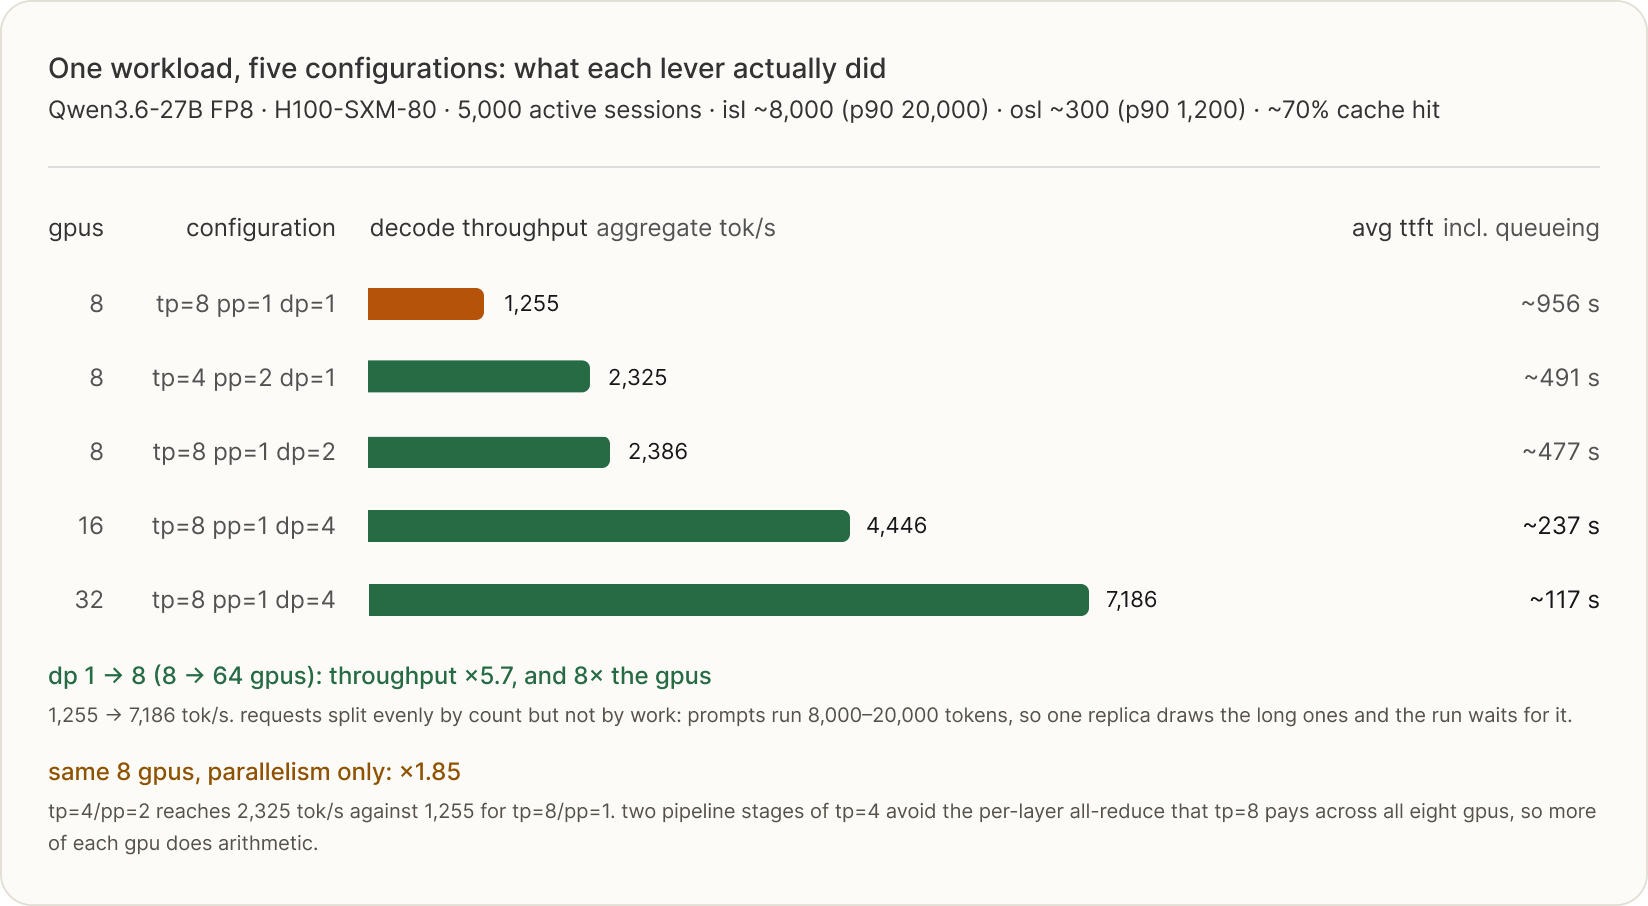
Figure 3. The same five configurations measured on one workload, so the levers read as numbers rather than directions. Scaling replicas dp=1 to dp=8 takes 8 GPUs to 64 and multiplies decode throughput by 5.7. On a fixed 8 GPUs, changing only the parallelism to tp=4/pp=2 gives 1.85×. TTFT here is dominated by queueing at 5,000 arrivals, so read the fall from ~956 s to ~117 s as backlog draining. It is not model latency.
Eight times the GPUs does not buy eight times the throughput. Requests split evenly by count. They do not split evenly by work. Prompts run 8,000 to 20,000 tokens, so the long ones land on one replica while the others finish early and sit idle. The run is scored on when the last request finishes, so that idle time drags the number down. This is why replicas, the simplest lever there is, still return 5.7× rather than 8×.
The obvious answer is to measure. Set up each option, send it realistic traffic, write down how fast it runs, and pick the best. Testing like this works, and it should always be the final check before you commit. The problem is that there are far too many combinations to test them all.
A meaningful benchmark run - enough traffic to reach steady state and read a stable number - takes roughly 30 minutes on the GPUs the configuration needs. At $50/hr for an 8×H100 node, a single 8-GPU test costs about $25. Test 50 configurations and you’re at about $1,250 and a full day of machine time; do it properly - a few traffic levels each, repeated for noise - and it’s closer to $6,000 and a week.
Now count the configurations. Each of these is a real choice you have to make, and they multiply:
And that is a conservative slice - it leaves out finer scheduler and runtime knobs. Figure 4 takes this exact grid through the pipeline. At $25 a test, running even this reduced grid on real hardware would cost around $290,000 and take months. In practice teams test a handful of configurations, pick the least-bad one, and leave most of the space unexplored.
As your product grows, prompts get longer, traffic rises, and usage patterns shift - and the configuration that won at launch may not win six months later. You can’t spend $6,000 and a week every single time your traffic changes.
No GPU cycles are used anywhere in the search. We explore all 11,520 configurations by simulating each one.
Not all of them get the same treatment. Our most accurate simulator replays the serving engine’s scheduler step by step. That costs a few seconds per configuration. Fine for twenty. Hours for eleven thousand. So the search runs as a sequence of stages. Each stage costs more per configuration than the last. Each sees fewer of them. The early stages are set algebra over model and device facts. Near-free, run on everything, and enough to drop whatever cannot work. Only the 20 that survive reach the step-by-step replay.
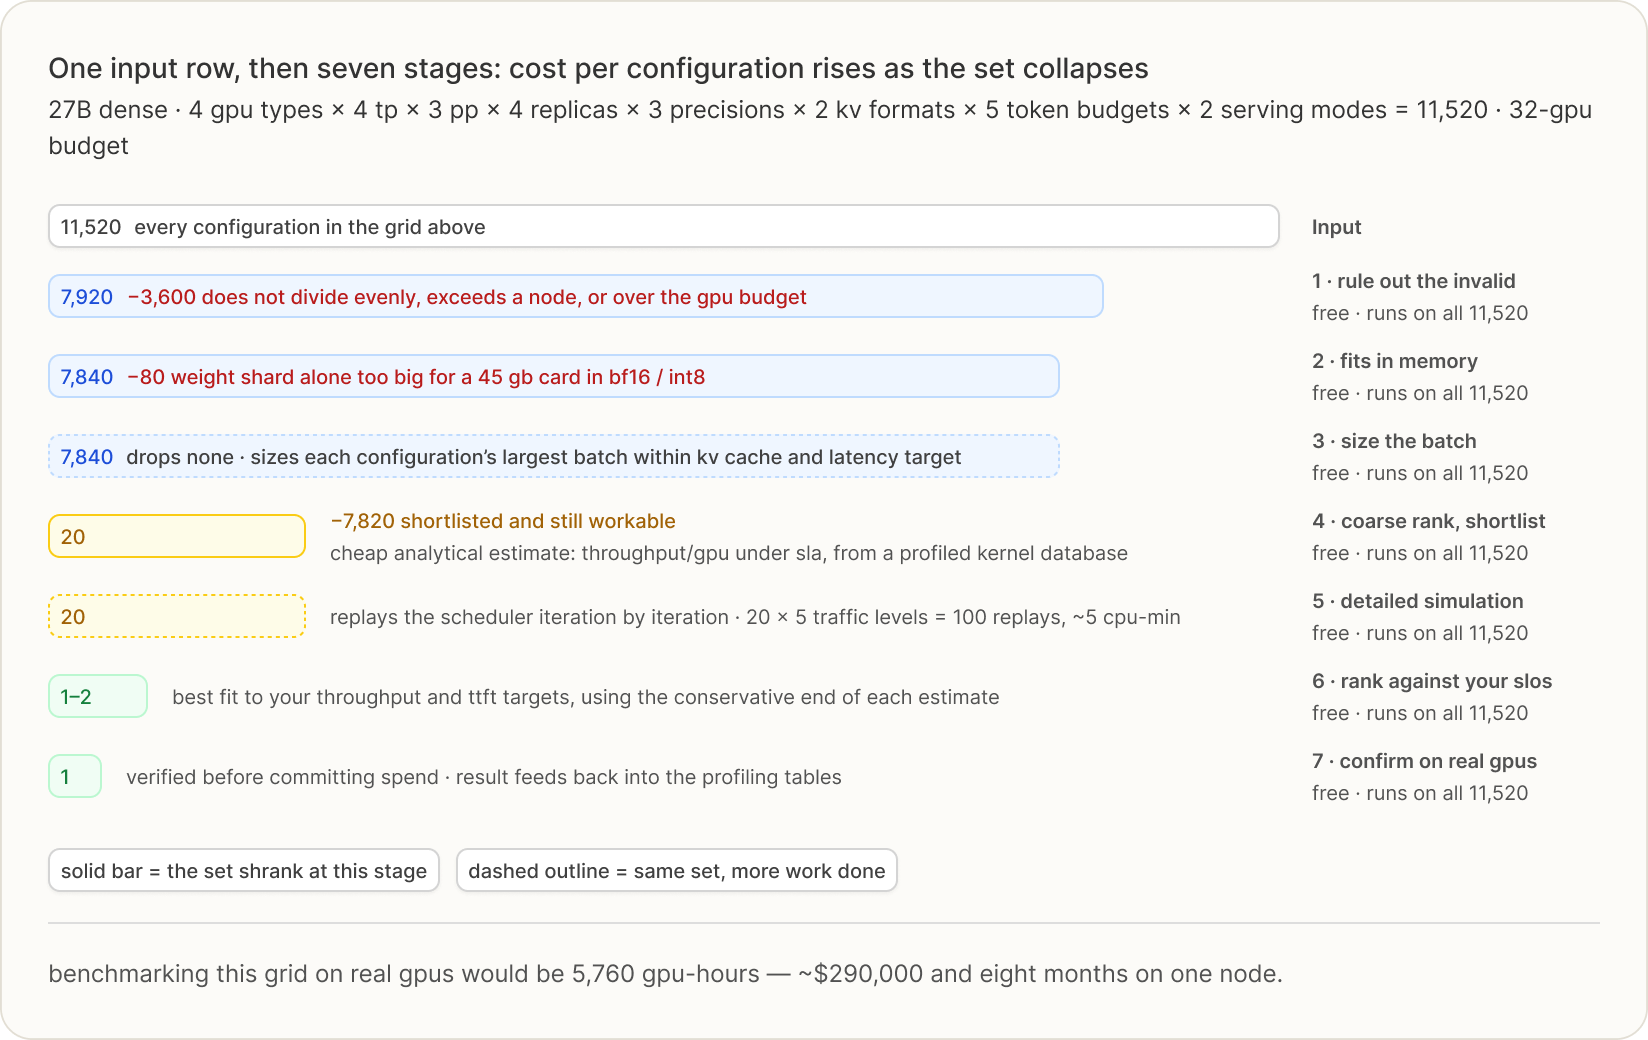
Figure 4. The top row is the input grid from the table above. The seven rows below it are the seven stages, one row each. A solid bar means the set shrank. A dashed outline means the same set with more work done. Cost per configuration is the point. Stages 1 and 2 are arithmetic and run on all 11,520. Stage 4’s analytical estimate is cheap enough to run on all 7,840 survivors. Only stage 5 costs seconds, and it sees 20. Only stage 7 touches a GPU, and it sees one. The decisive cut is the shortlist at stage 4. Those 7,820 are set aside rather than rejected. They would all run. Benchmarking this grid on real GPUs is 5,760 GPU-hours, roughly $290,000 and eight months on one node.
Seven stages. Each runs on everything the previous one passed. Each costs more per configuration than the last. The counts are for the 11,520-configuration grid in the table above.
1. Rule out the invalid. Some configurations cannot physically run. For this model the checks look like this. Tensor parallelism has to divide both the attention head count and the embedding width, pipeline depth has to divide the layer count, the configuration has to fit inside one node, and GPUs per replica times replica count has to stay within the GPU budget you are willing to provision. Integer arithmetic on the model shape, so effectively free. Removes 3,600 of 11,520, leaving 7,920.
2. Check it fits in memory. Per GPU, take 90% of the card as the budget, subtract the weight shard, and convert what remains into fixed 16-token KV cache pages. Reject anything whose weights alone overflow the budget, or that cannot hold one page plus a 1% reserve. This takes microseconds per configuration. Removes 80, leaving 7,840.
3. Size the batch. For each surviving configuration, sweep batch size and parallelism to find the largest batch it can actually run before it either runs out of KV cache or misses your latency target.
4. Coarse rank, and shortlist. A cheap analytical estimate - throughput per GPU under your SLA, read from a profiled kernel database with interpolation rather than by simulating anything - orders what is left and keeps the top 20. This is the decisive cut: 7,840 down to 20.
5. Detailed simulation. The event simulator runs only on the survivors. It replays the serving engine’s scheduler iteration by iteration - admission, the per-iteration token budget, chunked prefill - reading each operation’s time from the profiled table. About 3 seconds per configuration.
6. Rank against your SLOs. Configurations are scored on how well they fit the targets you actually gave - throughput and time-to-first-token - using the conservative end of each simulated estimate rather than the midpoint.
7. Confirm on real hardware. The one or two finalists get a real deployment on real GPUs to verify the number before you commit the spend. That run also feeds back into the profiling and calibration data.
The shape of the cost is the point. Stages 1 and 2 are arithmetic and run on all 11,520. Stages 3 and 4 are analytical estimates, cheap enough to run on everything that survived. Only stage 5 costs seconds, and it sees 20. Only stage 7 touches a GPU, and it sees one. Set against the alternative: benchmarking the full grid on real GPUs is 5,760 GPU-hours, about $290,000 and eight months on a single node. This path is a CPU search measured in minutes, plus one confirmation run on GPUs - $25 of hardware.
Assumption: candidate decode throughputs are separated by more than the prediction error.
Ranking only needs the configurations in the right order. Exact speeds do not matter. An 8% band preserves the order whenever candidates differ by more than that; when two fall inside it we report a tie and name the single benchmark that settles it. Benchmarking is not removed, it is reduced to the one or two configurations where it changes the decision.
We served Qwen 3.6 27B FP8 with vLLM on H100s at TP=2, drove it with SWE-bench coding traces, and compared predicted against measured decode throughput in every two-minute window, with nothing trimmed and no outliers removed.
max_num_batched_tokens is the per-iteration token budget: the most tokens the scheduler may place in one forward pass across every request in the batch. It is not a per-request sequence limit. It matters here because it decides how much of each forward pass goes to reading new prompts instead of generating tokens. That contention is the part the prediction models least well. The error below tracks it.
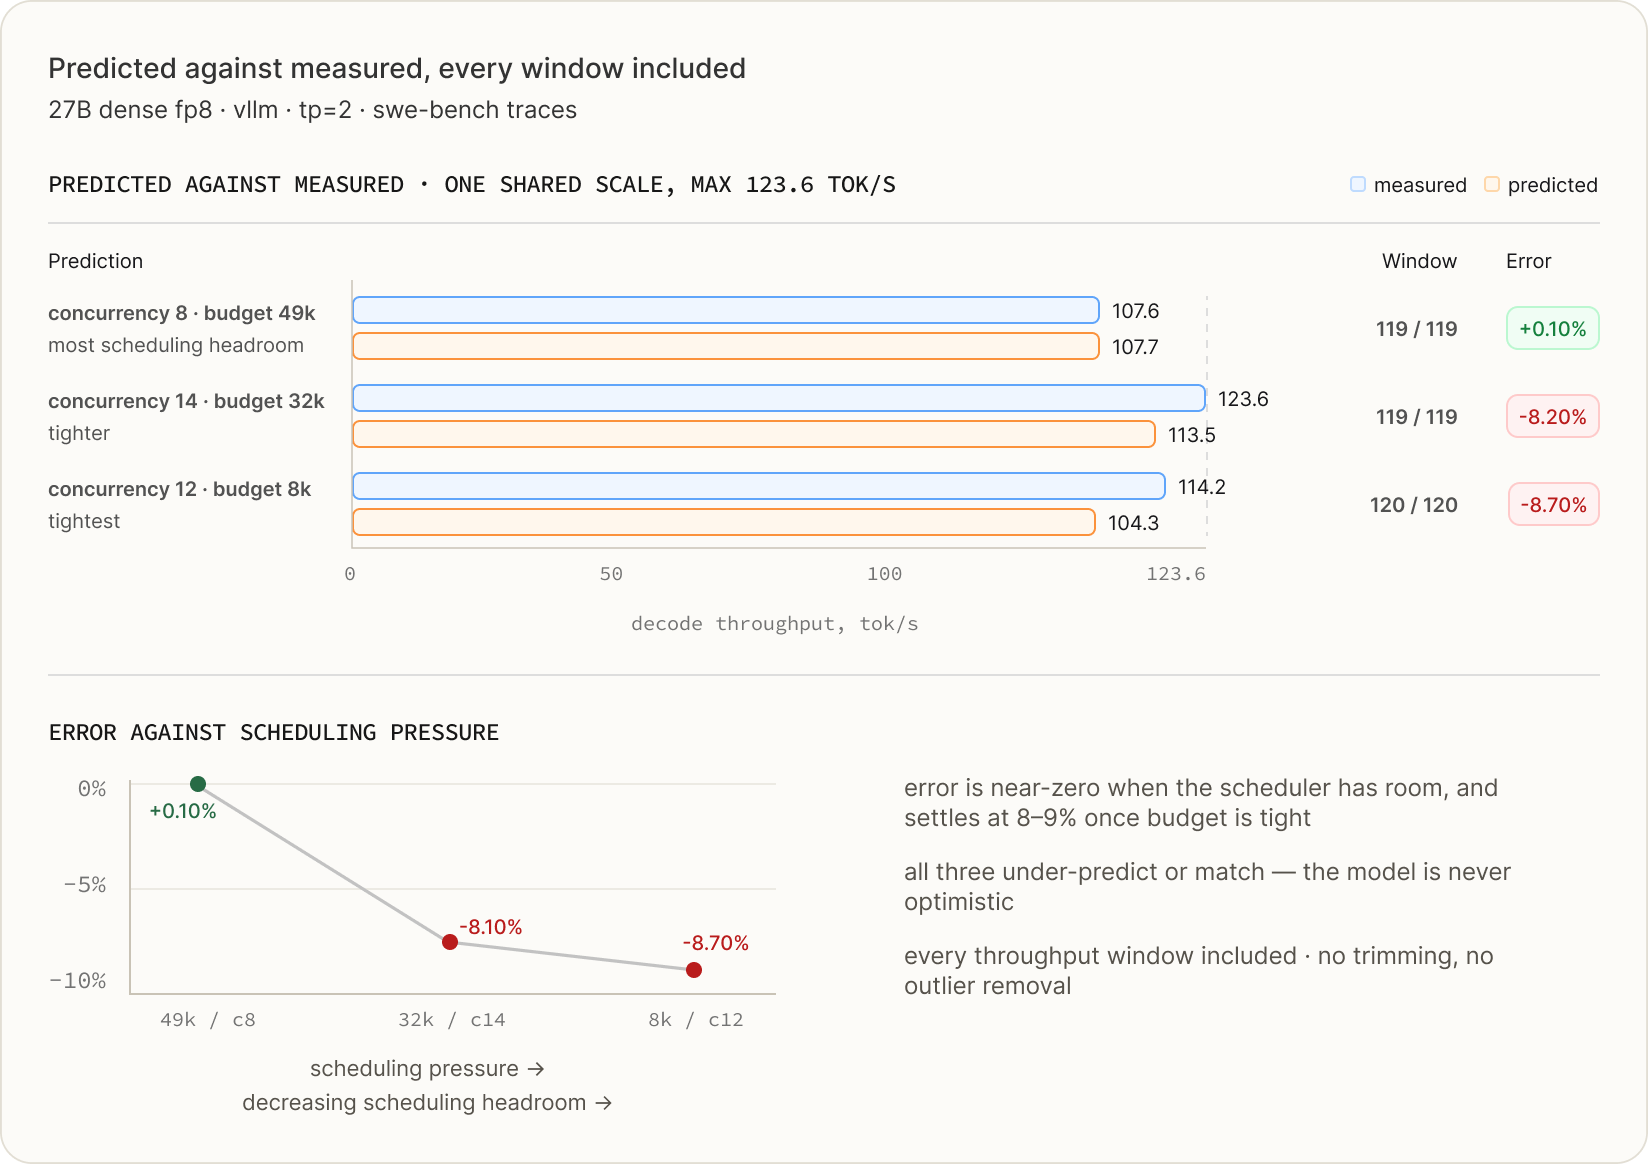
Figure 5. Rows run from most tokens per request to fewest, and the error grows as that number shrinks: 6,144 tokens per request is off by 0.10%, 683 by about 9%. This is aggregate decode throughput - the number you size a cluster on. Per-request latency is a harder problem, and we’re upfront below about where it holds and where it doesn’t.
Across every configuration tested, predicted decode throughput lands within 8.7% of measured. The error tracks the per-request token budget. The direction is consistent: all but one comparison under-predicts, and the exception over-predicts by 0.10%. For sizing that is the safe direction - if we say a configuration sustains 5,000 tok/s and we under-predict, the real hardware has slightly more headroom than promised.
A matching mean can come from cancelling errors, so the stronger test is whether the prediction tracks throughput as traffic rises and falls. Below is the same four-hour run in two-minute windows.
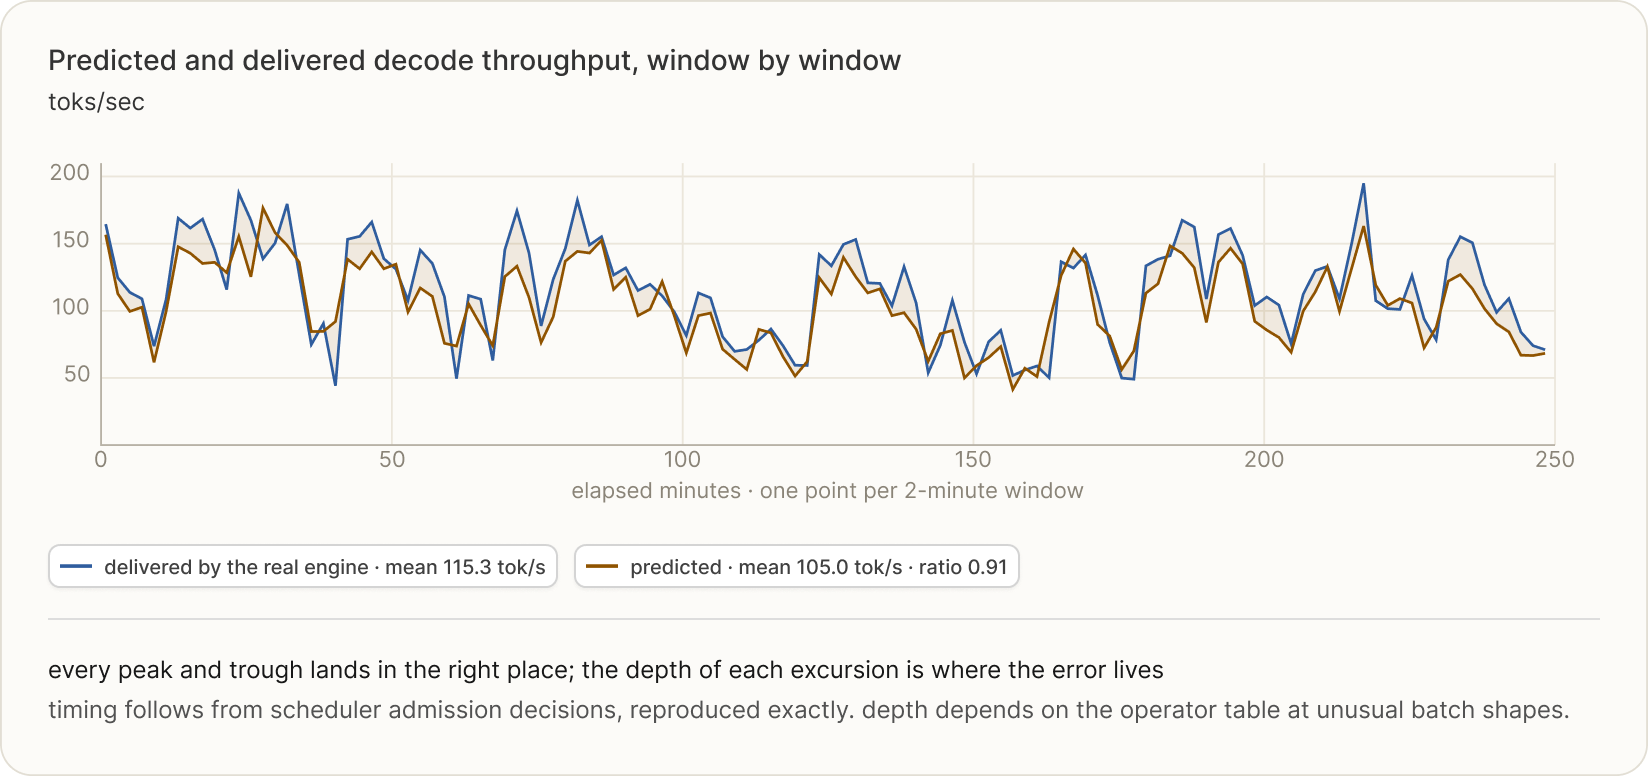
Figure 6. SWE-bench traffic is bursty, so decode throughput swings between ~45 and 195 tok/s as long prompts consume the per-iteration token budget and briefly starve decode. What matters is that the prediction turns where the real system turns, ~120 times over the run, without ever seeing the real trace. The only gap is a steady ~9% under-prediction - we track the shape, we’re just slightly conservative on the level.
We ran the same test on a mixture-of-experts model, Qwen 3.6 35B-A3B, where per-token compute depends on which experts each token activates - harder to predict. The match was tighter still.
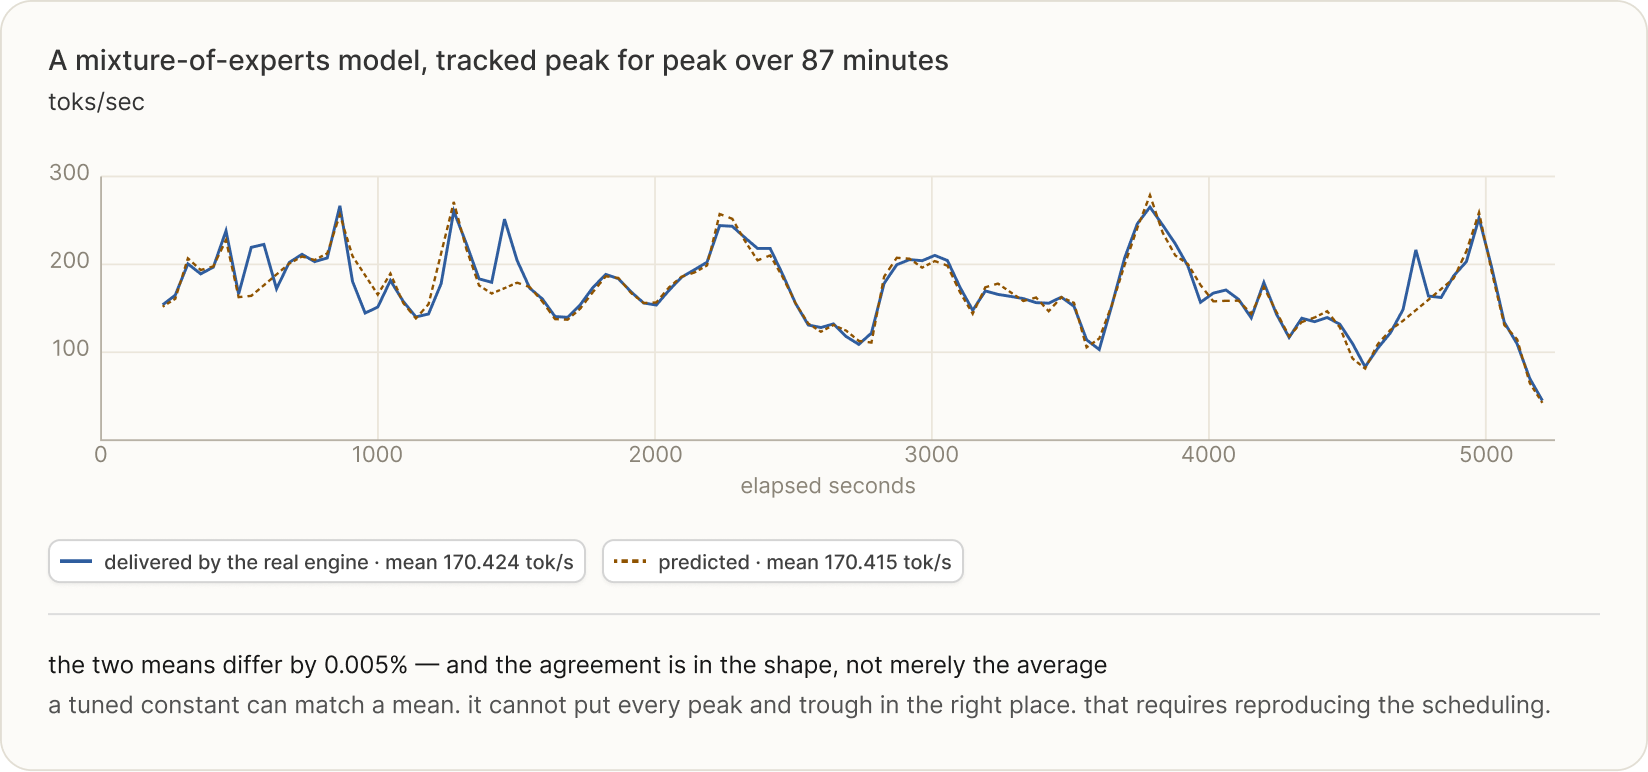
Figure 7. Over 87 minutes, the real average was 170.424 tokens a second and we predicted 170.415 - 0.005% apart. Agreement to three decimal places on the mean is coincidence; the load-bearing result is that the two series track each other across the whole run, which requires the per-iteration behaviour to be right.
We used AIPerf to generate the trace once from a fixed seed using its agentic code-generation dataset. The simulator’s CSV is a column-by-column copy of that trace. Five fields are pinned per request: input length, output length, arrival time, session, and prefix blocks for cache reuse.
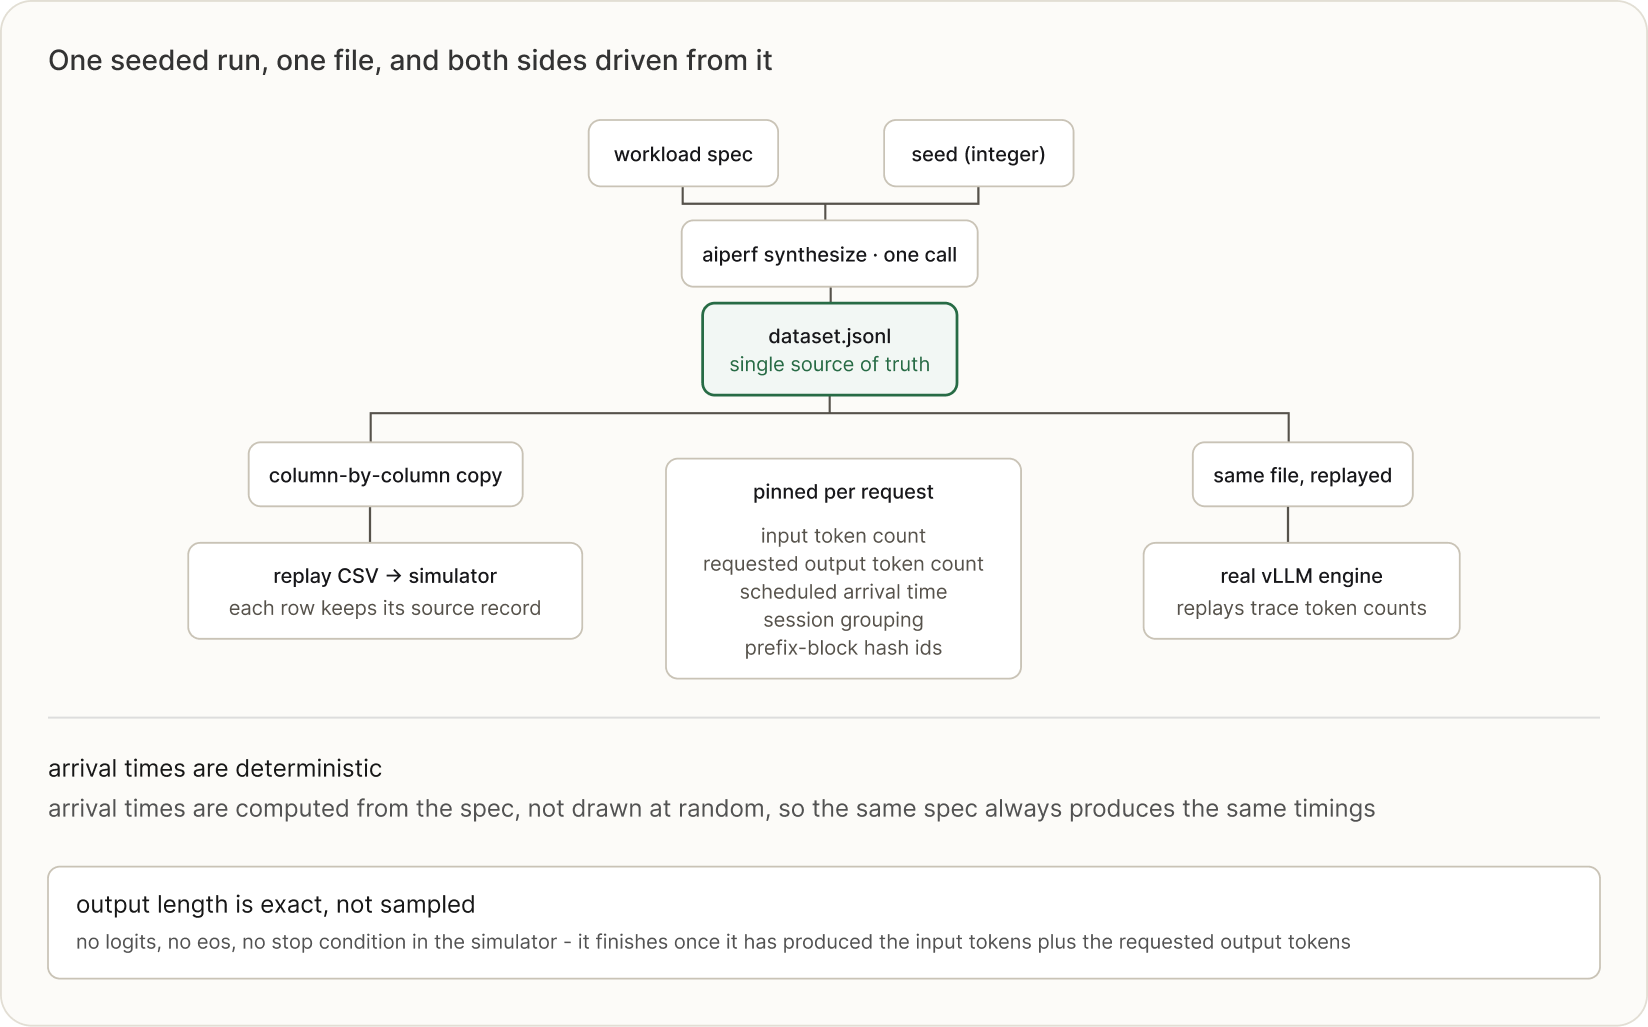
Figure 8. Both sides are driven from one file rather than reconciled afterwards. A single seeded AIPerf run emits the trace; the CSV the simulator reads is a column-by-column copy of it.
The system predicts throughput accurately enough to get the full ranking right. It tells you which configurations are clearly better, flags the handful that are genuinely too close to call, and sends only those few to real hardware to settle.
Decode throughput is output tokens over wall-clock time. We decompose that into three segments, each modelled and validated on its own:
Iteration cost. For a fixed batch, what is the wall-clock time of one forward pass? This is where the hardware lives: bytes streamed over weights and KV cache against HBM bandwidth, per-operator kernel latency, collective cost, and attention-family-specific KV cache memory layouts.
Batch composition. Which requests occupy that pass? This is scheduler policy rather than hardware: admission against the per-iteration token budget, chunked prefill, preemption and rollback, prefix-cache hits, and paged block allocation. It does not collapse into an average batch size, which is why we replay the scheduler instead of approximating it.
Arrival process. What drives the two above? Request count, ISL and OSL distributions, inter-arrival timing, session structure and prefix-reuse pattern - taken from the materialised trace rather than modelled.
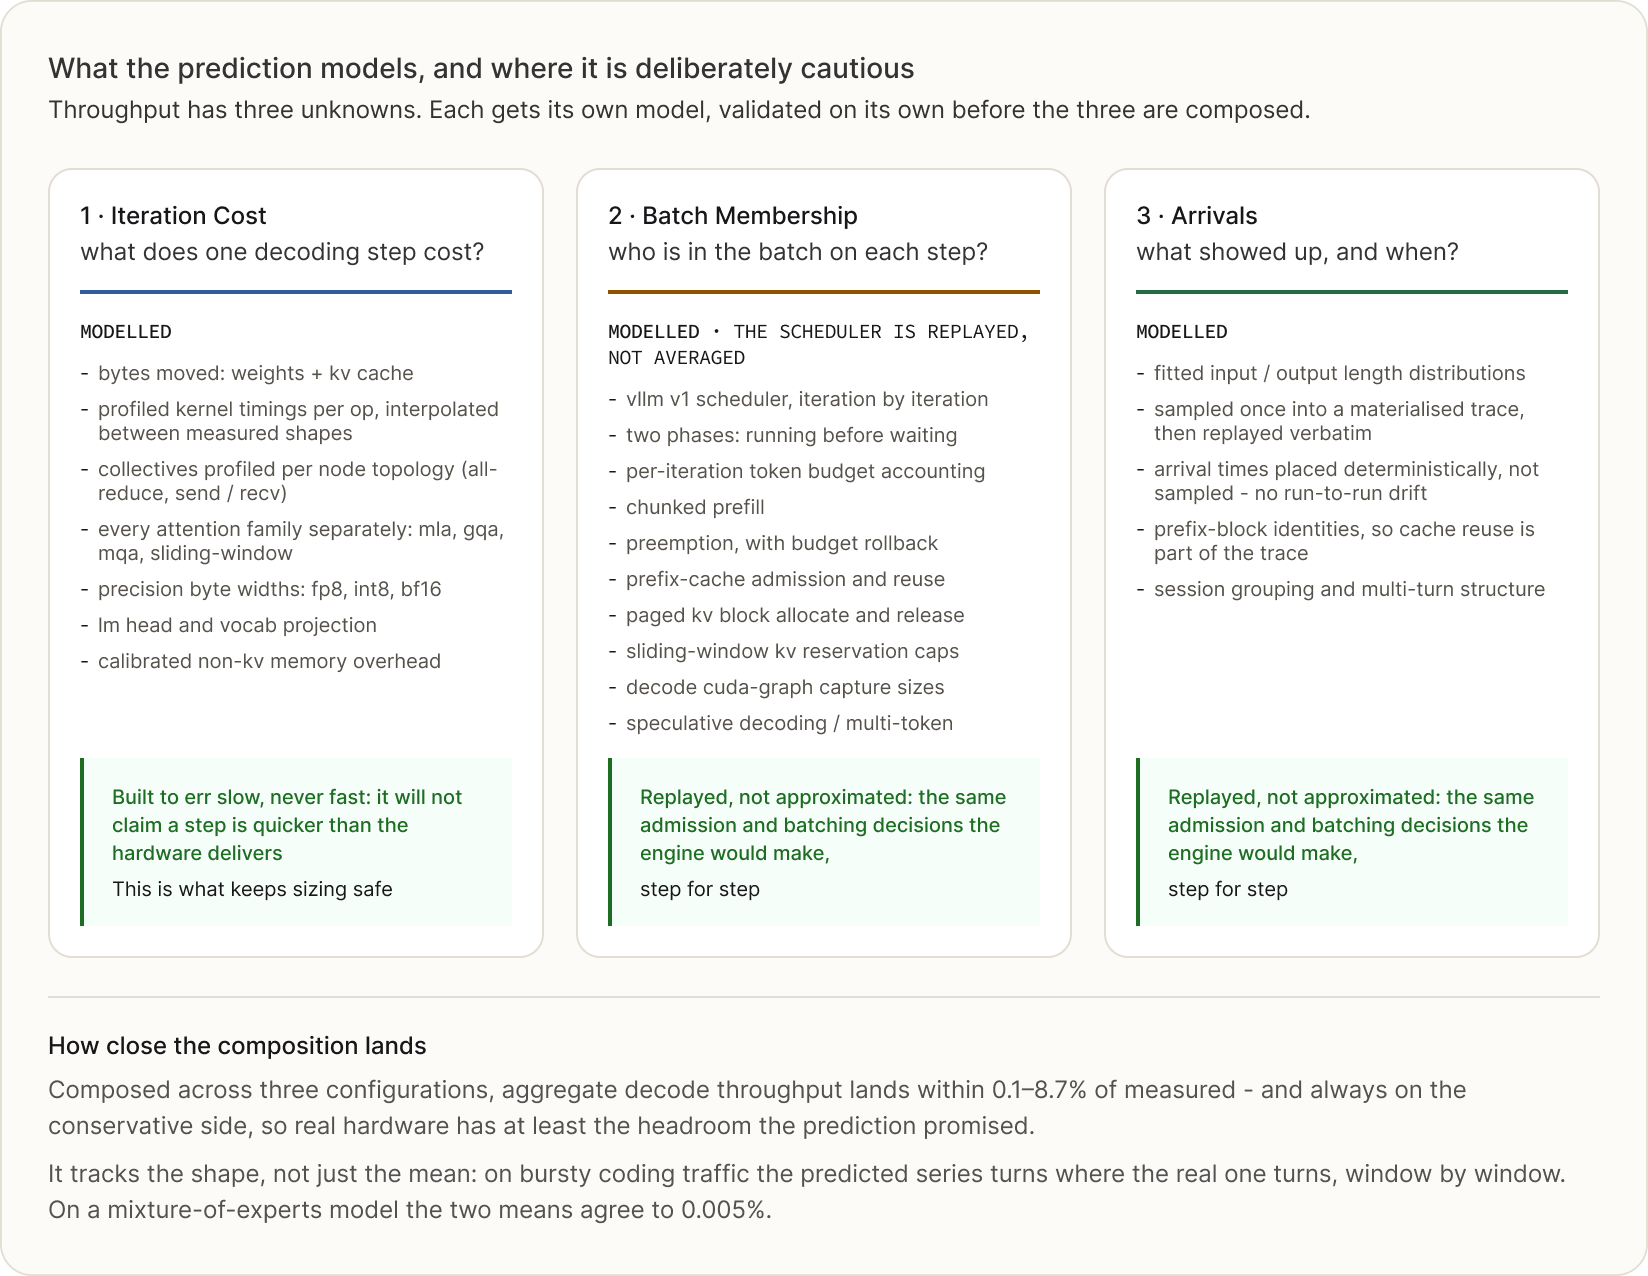
Figure 9. Throughput has three unknowns, and each gets its own model rather than a fudge factor. The middle column is the one that matters most: the scheduler is replayed iteration by iteration. Composed, the three land within 0.1-8.7% of measured decode throughput across three configurations.
Two of these carry most of the risk. Iteration cost is deliberately biased slow rather than fast. And the scheduler: which requests share a batch cannot be reduced to an average batch size, so we replay the real vLLM scheduler instead.
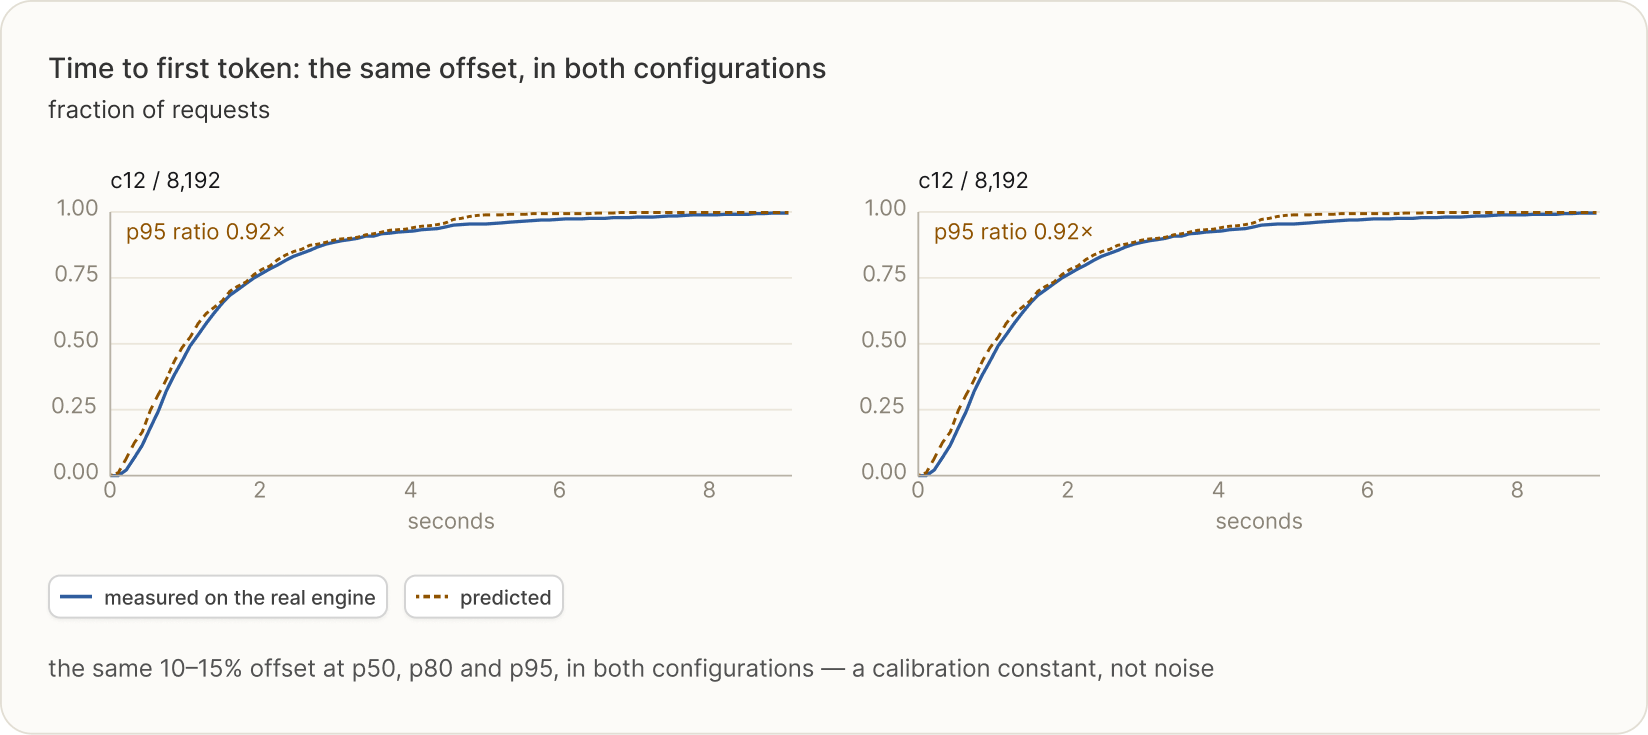
Figure 10. Time-to-first-token is where the scheduler replay still slips. The predicted distribution sits the same small distance off the measured one at p50, p80 and p95, in both configurations. That is a steady bias. The shape is right and simply shifted.
Predicted TTFT lands ahead of measured TTFT by the same margin at every percentile, in both configurations. A fixed offset like that points to something structural. Closing this gap means modelling that fixed cost directly. It does not mean adjusting the scheduler replay. That replay already gets the shape right.
We ran three traffic patterns through the search on the same model and GPU fleet. Each returned a different best configuration, because each binds on a different limit.
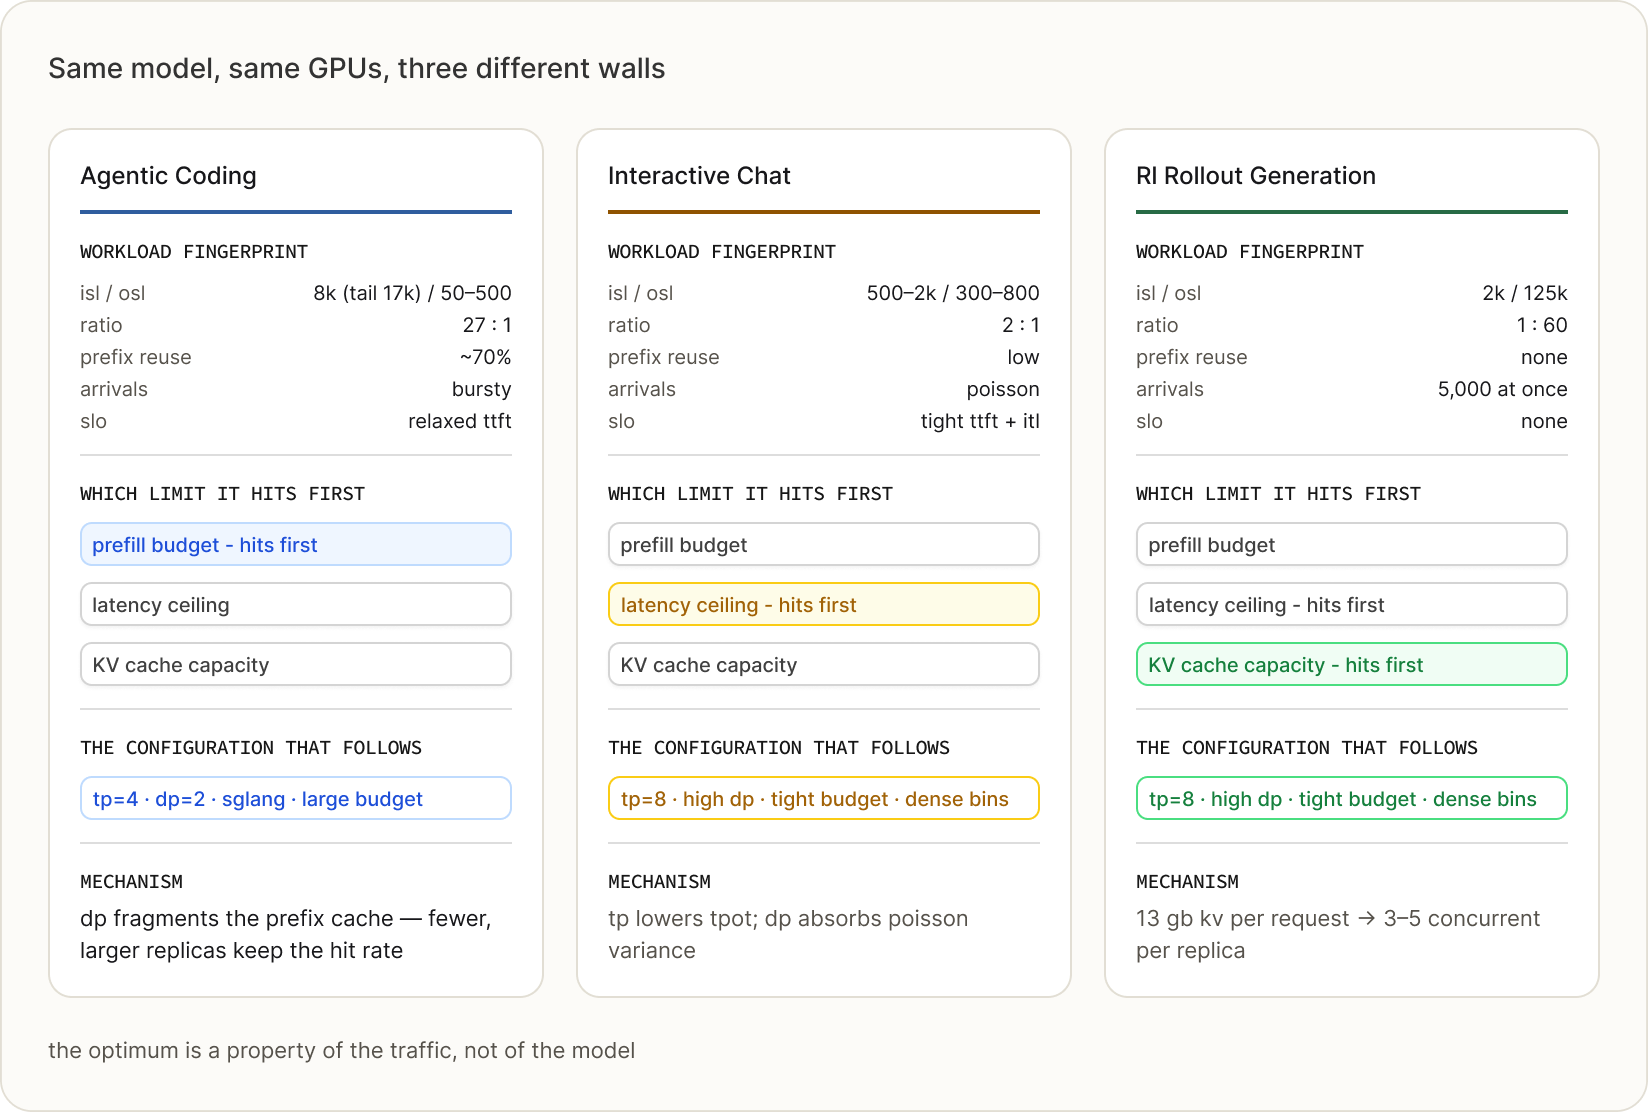
Figure 11. Same model, same GPUs, three traffic patterns - each runs into a different limit first (the diagonal). Coding hits the arithmetic/prefill wall, chat hits the latency wall, reasoning hits the KV cache capacity wall.
We described these workloads in Figure 2 also. Coding binds on compute. Chat binds on bandwidth. Reasoning binds on VRAM. The configuration that wins is the one that relieves whichever wall your workload hits. None of this shows up on a spec sheet. The search finds the binding wall for your workload. It picks the configuration that moves it.
If you’re staring at the same question - how many GPUs, arranged how, for the traffic you serve today and the traffic you’re growing into - you don’t have to guess your way to an answer or burn weeks of GPU time benchmarking a handful of configurations. Describe your model and the traffic you expect, and we’ll search the space for you and come back with the configuration that fits, the GPU count behind it, and the evidence for why.

 22nd October, 2026